Karting data analysis is mostly about answering one question well: did the change you just made find time, and where? Compare clean laps from before and after the change against the same reference, look at speed and RPM corner by corner, and check that track conditions didn’t change underneath you. If you skip that last part, the data will regularly tell you something that isn’t true.
Most guides to reading a speed trace stop at “overlay two laps”. That’s the start of the job, not the end. This post is about turning a logger download into a decision you can trust on the next run.
Why do setup changes look better (or worse) than they are?
Because a kart is never tested in isolation. Between two sessions at a UK club meeting the track rubbers in, the sun comes out or goes in, tyres gain or lose heat cycles, the fuel load changes and the driver gets more comfortable. Any of those can be worth more than a quarter turn of caster or a tooth on the rear sprocket.
The common traps are:
- Track evolution. Early morning practice at a green circuit often gets faster all day regardless of what you touch. A change made between first and second practice “works” on almost any kart.
- Different tyres. A fresher set, or a set with different pressures from the cold, makes the comparison meaningless.
- One hero lap. A tow down the straight or a single good exit can drop a tenth that has nothing to do with the setup.
- Changing two things. If you went up a sprocket and dropped pressures in the same stop, you can’t separate the effect of each.
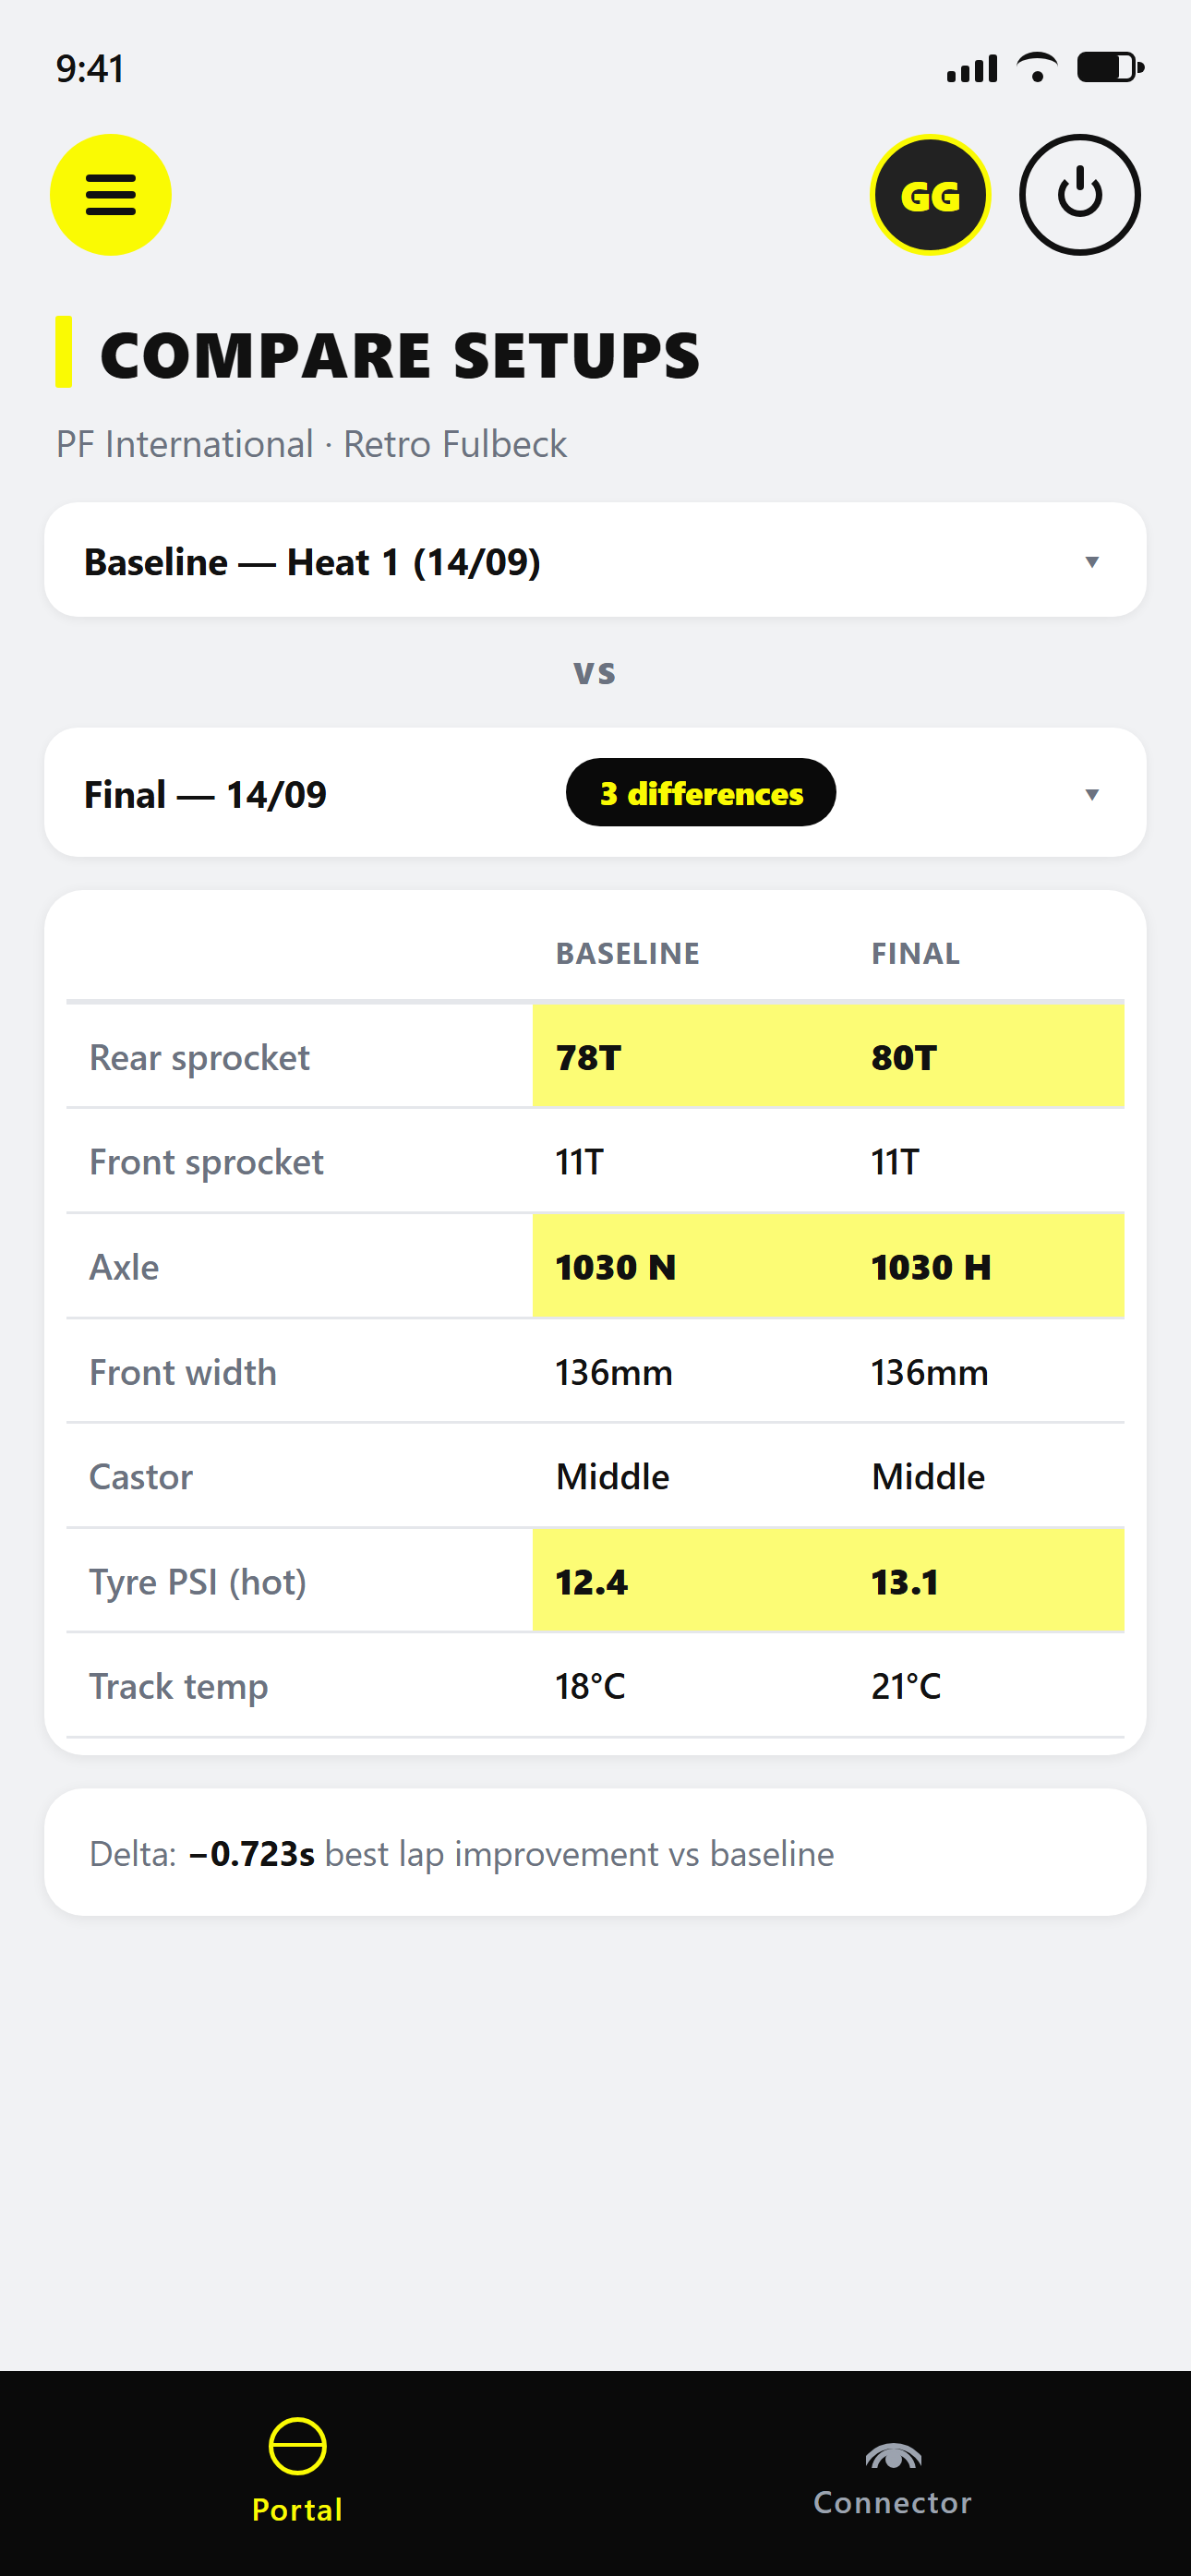
Good analysis starts before the kart leaves the dummy grid: one change at a time, written down, with the conditions recorded alongside it.
What should you record for every session?
Record the setup and the conditions every time, not only when you change something. A run you think of as a baseline only becomes useful as one if you can see exactly what it was.
A practical minimum per session:
| What | Why it matters for analysis |
|---|---|
| Front and rear sprocket | Explains RPM and top speed differences |
| Cold and hot tyre pressures | Grip and how quickly the tyres come in |
| Tyre set and laps used | Separates setup gains from tyre wear |
| Axle, hubs, seat stays, ride height | The usual chassis changes for grip |
| Front end: caster, camber, toe, track width | Turn-in and front grip |
| Carb settings or jetting | Engine response, especially in changing air |
| Air temperature, track temperature, weather | The context for every lap time |
| Session type and time of day | Practice, heat or final; track state |
Paper works if you’re disciplined about it. We built KartSetups because paper sheets didn’t survive the van and nobody could find last year’s notes from the same track. It stores the setup per session and pulls in the weather automatically, so the context is there when you look back.
How do you compare two sessions properly?
Compare a set of clean laps from each session, not just the two best laps. Then go from the lap list to the traces, and only then to conclusions.
- Pick representative laps. Drop out-laps, in-laps, laps with traffic or a spin, and anything clearly affected by a yellow flag. From what’s left, take the best three to five.
- Compare averages and best laps. If the best lap improved but the average of the best five didn’t, you’ve probably found a tidy lap rather than a better kart.
- Check the gap to theoretical best. Most logger software builds an ideal lap from your best sectors. A large gap between best and ideal points at consistency rather than the setup. AIM explains this in its guide to reading lap times in Race Studio 3.
- Overlay the best representative lap from each run. Use speed against distance, not time, so the corners line up.
- Read the time delta trace. It climbs where you lose time and falls where you gain it. Note the two or three corners where it moves most.
At this point you should be able to say something like “the change was worth roughly a tenth, almost all of it from the two slow hairpins”. That’s a finding. “It felt better” isn’t.
Which channels tell you what the setup did?
Speed and RPM do most of the work, with water temperature as a check. You don’t need a full sensor kit to get useful answers.
Speed: the shape of each corner
Each corner shows up as a valley on the speed trace. When you compare runs, look at three things in every valley:
- Braking. Where the speed starts to fall, and how steeply.
- Minimum speed. The lowest point of the valley. In karting, minimum corner speed explains a lot of the gap between laps in the same equipment.
- Exit. How quickly speed climbs back up afterwards.
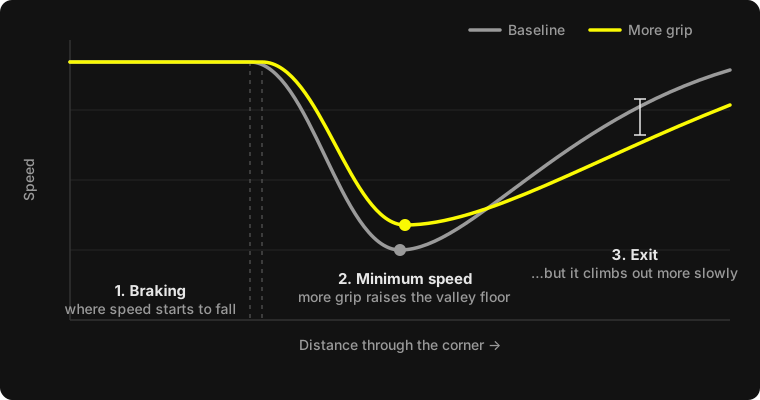
A grip change usually shows up as a trade between minimum speed and exit. More grip can raise the minimum but slow the climb out of the corner if the kart starts to bind on a low-powered engine. Less grip can do the opposite. If you added grip and the valley floors rose while the exits flattened, you may have gone too far, even if the lap time was similar.
RPM: a second speed trace and a gearing check
On a direct-drive kart, RPM and speed are locked together by the sprocket ratio, so the RPM trace has the same shape as speed. It’s still worth checking separately because it shows things speed hides:
- Peak revs at the end of the longest straight. If you hit the limiter or the top of the useful power band well before the braking point, the gearing is probably too short for that track and conditions, so try fewer teeth on the rear. If revs are well short of the band, you may need more.
- RPM floor in the slowest corner. If the engine drops below where it pulls cleanly, the exit suffers even when the minimum speed looks fine.
- Clutch engagement on clutched classes, visible as revs rising faster than speed off a slow corner.
Your engine’s useful rev range depends on class and engine, so compare runs against each other and against your own best data at that track rather than chasing a number from someone else’s kart.
Water and exhaust temperature: health and context
Temperatures rarely explain lap time directly, but they tell you whether two runs are comparable. If water temperature sat noticeably lower in one run because you changed the radiator tape, that may have changed engine performance as much as the setup did. Check the values against your engine manufacturer’s recommended range, and note any big difference before crediting the chassis.
How do you account for changing conditions?
Assume the track got faster unless you have evidence it didn’t. The simplest evidence is a reference: someone in your team running the same baseline, or a rival whose times you can see on the timing screen. If everyone improved by two tenths and you improved by three, your change was worth about one.
A few other habits help:
- Back-to-back runs. Within a single session, where the rules and tyre allocation allow it, come in, make the change and go straight back out. Conditions shift less over ten minutes than over two hours.
- Return to the baseline. If you have time in practice, go back to the original setup for a short run. If the old setup is now as fast as the new one was, the track did the work.
- Compare like with like across meetings. A change that worked at Whilton Mill on a hot July afternoon may not carry over to a cold, green PFI in March. Keep conditions next to every result so the comparison is honest.
How do you build a setup history you can trust?
Write down a one-line conclusion for every change, including the ones that didn’t work. Over a season those lines become the most valuable part of your data.
A useful format is: track, conditions, what changed, the lap time effect, and where on track it showed. For example: “Whilton Mill, dry, 14°C, rear pressure down 1 psi cold, about a tenth quicker on average, gained mostly in the slow sections, lost a little in the fast sweepers.”
After a few meetings you can answer questions that otherwise rely on memory: which axle works at this track in the wet, what pressure you started at last time it was this cold, whether a sprocket change ever helped here at all.
This is where software genuinely saves time. In KartSetups, the sessions list shows which setup changes were made between consecutive sessions next to the lap time delta, and a setup change knowledge base groups those changes by track with average, best and worst lap deltas. Compare Setups puts two sessions side by side with the differences highlighted, and AIM, Alfano and Starlane files import into the same session so the traces and the setup live together. The release notes list when each of these arrived.
What mistakes should you avoid?
- Analysing everything at once. Pick the two corners where the delta moved most and understand those.
- Trusting one sensor blindly. A wheel speed sensor reads differently as the tyre wears. GPS speed avoids that but can be noisy under trees or near buildings.
- Ignoring the driver. A setup change that makes the kart easier to drive often shows up as better consistency rather than a faster best lap. That still counts.
- Forgetting the notes. Data without the setup and conditions attached is just a pretty graph six months later.
Data analysis doesn’t replace seat time or a good mechanic’s eye. What it does is stop you repeating changes that never worked and help you return quickly to the ones that did. If you want to try logging setups and telemetry together, every KartSetups plan starts with a free trial.